
This is a quick guide on how to build a calibration table in Ezchrom. This should work in both Ezchrom Elite as well as Openlab Ezchrom.
1. Have your method(s) that you would like to use saved and ready. This first step is pretty straightforward. You want to have a good idea of what your method parameters will be before you start building your calibration table.
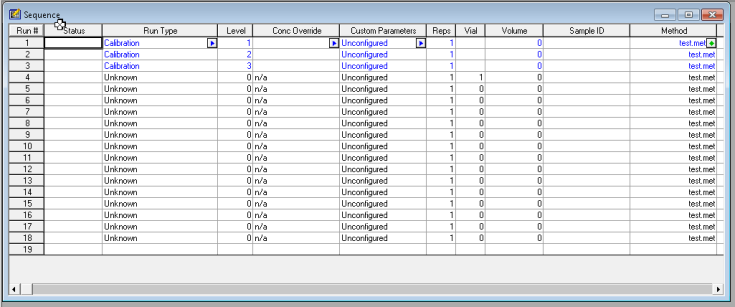
2. Set up a sequence of runs with your calibration standard(s). In my example, I am using three levels of calibration. If you expect your samples to be within a certain range, you want to select standard concentrations that will cover that range. So, if my samples will have a concentration in a range of 50-75 ng/ul for example. Then I would want to choose standards at 30, 60, and 90 ng/ul, perhaps. Whichever calibration levels you choose to have, make sure you have them ready and know which vials they are in, and designate that in your sequence table.
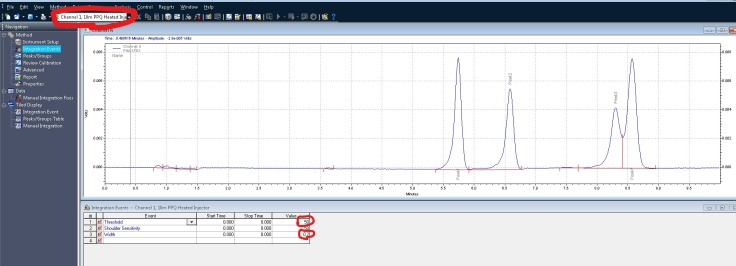
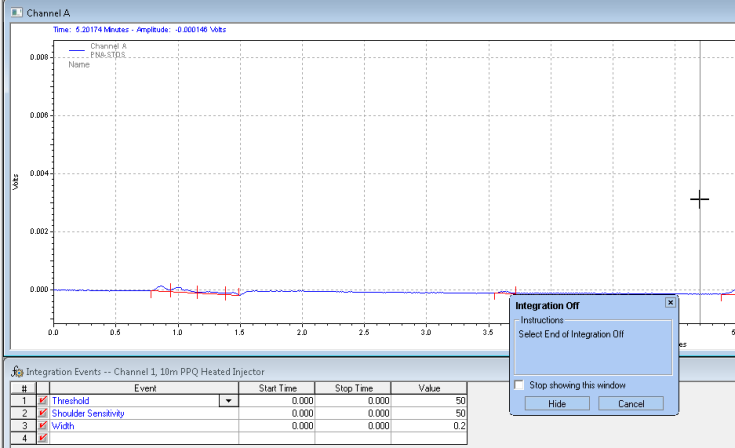
3. Integrate your peaks. Make sure you have the proper channel selected at the top, for the chromatogram that you want to adjust. Next select integration events, the two values you want to focus on at first are threshold and width. You can keep clicking analyze to see how your changes affect the integration. It’s more or less a trial and error approach. There are several other options you can continually add to your integration table to fine tune your chromatogram.
In this example, I would like to remove some non peaks at the start of the chromatogram. I can click on integration off, on the bottom of the screen. It then wants you to click on the chromatogram where you want to start the cut off:
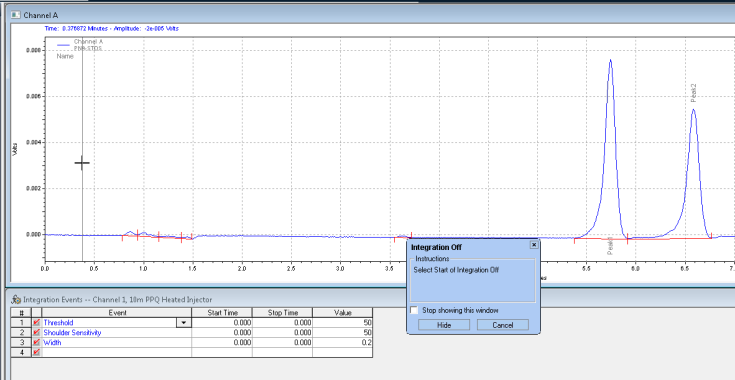
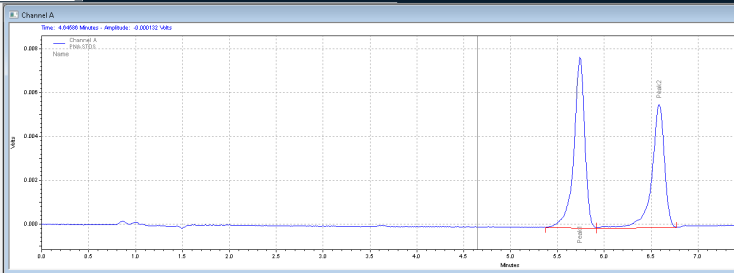
Next it wants you to click where you want the integration off event to stop:
After you analyze, you get the chromatogram with the unwanted peaks removed:
4. Calibration. After integrating your signals, the next step is calibrating. Peak selection can be done graphically on the chromatogram. You can click on the icon to define peaks, click at the start of the peaks, then click at the end of the peaks. The peak table will come up, and you can name the peaks, and designate their concentrations.
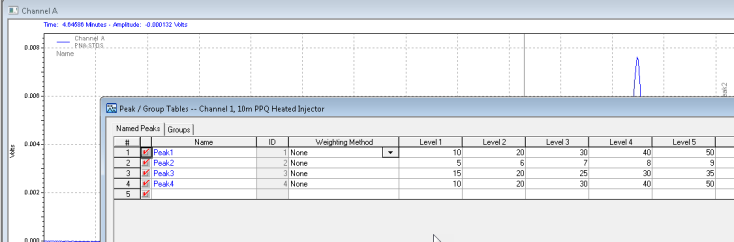
Save these changes to your method, and the software will now calculate the amounts of your unknowns based on your calibration table!

can a calibration Curve be ran with the samples (with just denoting them in Sequence as Calibration in Sample type ) and the Amount of the sample be calculated with this calibration samples ?? ran in the same table ??
LikeLike