If you collected spectral data in your run and would like to extract a wavelength from that data, you can follow these steps below.
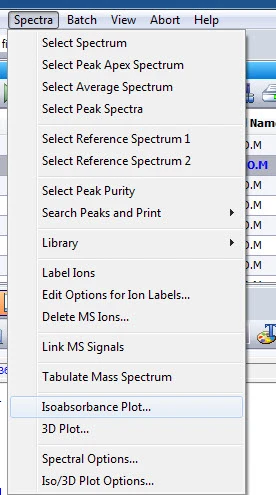
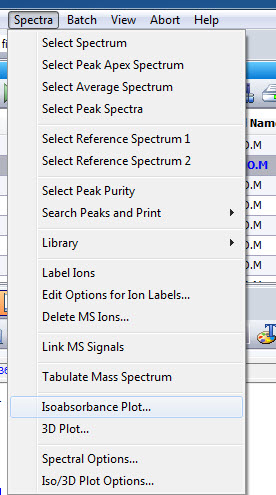
First, load your data file. Next, select Spectra then Isoabsorbance plot.
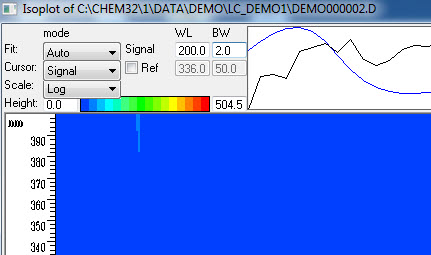
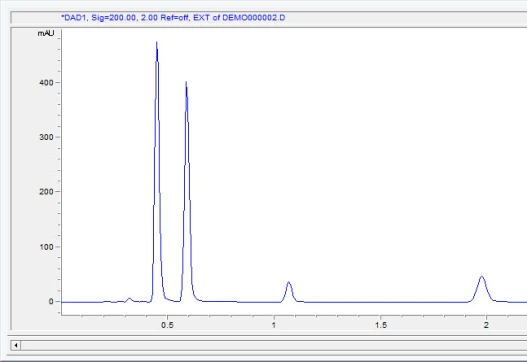
On the upper left box on the screen you want to change Cursor to Signal. Then select the wavelength you would like to extract. In this example I chose wavelength 200. You can also specify a reference signal and bandwidth as well if needed.
After selecting the desired signal, push copy at the bottom then hit ok. You may get a pop-up message about temporary data, you can hit ok to that as well. You will now see your chromatogram for the signal you extracted.
Leave a comment